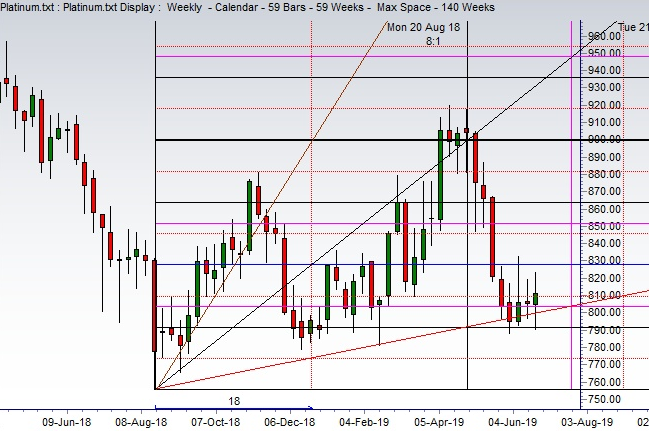
This Chart and commentary was made on: 19-Dec-2017
For the benefit of: Day traders / Swing Traders / Short term Investors
Market Trend Daily: BULLISH
Market Trend Weekly: BEARISH
Market Trend Monthly: BEARISH
Commentary for the period: 19-Dec-2017 to 19-Mar-2018
How to Use instruction: Send on registered email to members
Price on 19-Dec-2017: 262.7
Mathematical Price Resistance/Support Points: 292.79, 322.79 (Market reached 321.80, 322.53, 323.28 three times during 19-Dec-2017 to 19-Mar-2018 and after meeting resistance it started to make a downward move)
Important Dates: 11-Jan-2018, 2-Feb-2018, 19-Mar-2018 (First Time Market reached 321.80 it was on 11-Jan-2018 a reversal point, Third time market reached 323.28 it was 2-Feb-2018 and trend was reversed for a short term.
This demo may have limited information for full information and instructions please log on with your ID.


0 Comments